
I used to treat problems as things that live in one place. Something breaks, you fix that thing, you move on. Two experiences taught me that this only works when the problem actually lives in one place, and a lot of them don’t.
The graveyard shift wasn’t a time management problem
Early in my BPO days, I worked graveyard shift. New to it, completely out of sync with the rest of the city. I’d wake up when everyone else was winding down, and getting to work meant relying on public transport that barely ran at that hour. I showed up tired most nights and figured the fix was obvious: better planning.
So I set more alarms. Mapped out faster routes. Left the house earlier. None of it moved the needle much. I was still dragging by the second half of most shifts.
What I’d missed was that this wasn’t one problem, it was a loop. Limited transportation made me more fatigued. Fatigue made me less productive. Being less productive didn’t fix the transportation problem, so the fatigue carried into the next shift, and the cycle just kept feeding itself. A causal loop diagram is what made this visible to me: two factors reinforcing each other, and no amount of individual effort on my end was going to break a loop I wasn’t even looking at correctly.
The thing that actually helped wasn’t in my control at all. My company had a sleeping lounge, which I’d filed away as a minor perk. It turned out to be the one thing that interrupted the loop. Not because it eliminated fatigue, but because it removed the late-night commute that was feeding the fatigue in the first place. I didn’t need better time management. I needed one fewer trip across a city with no transit running.
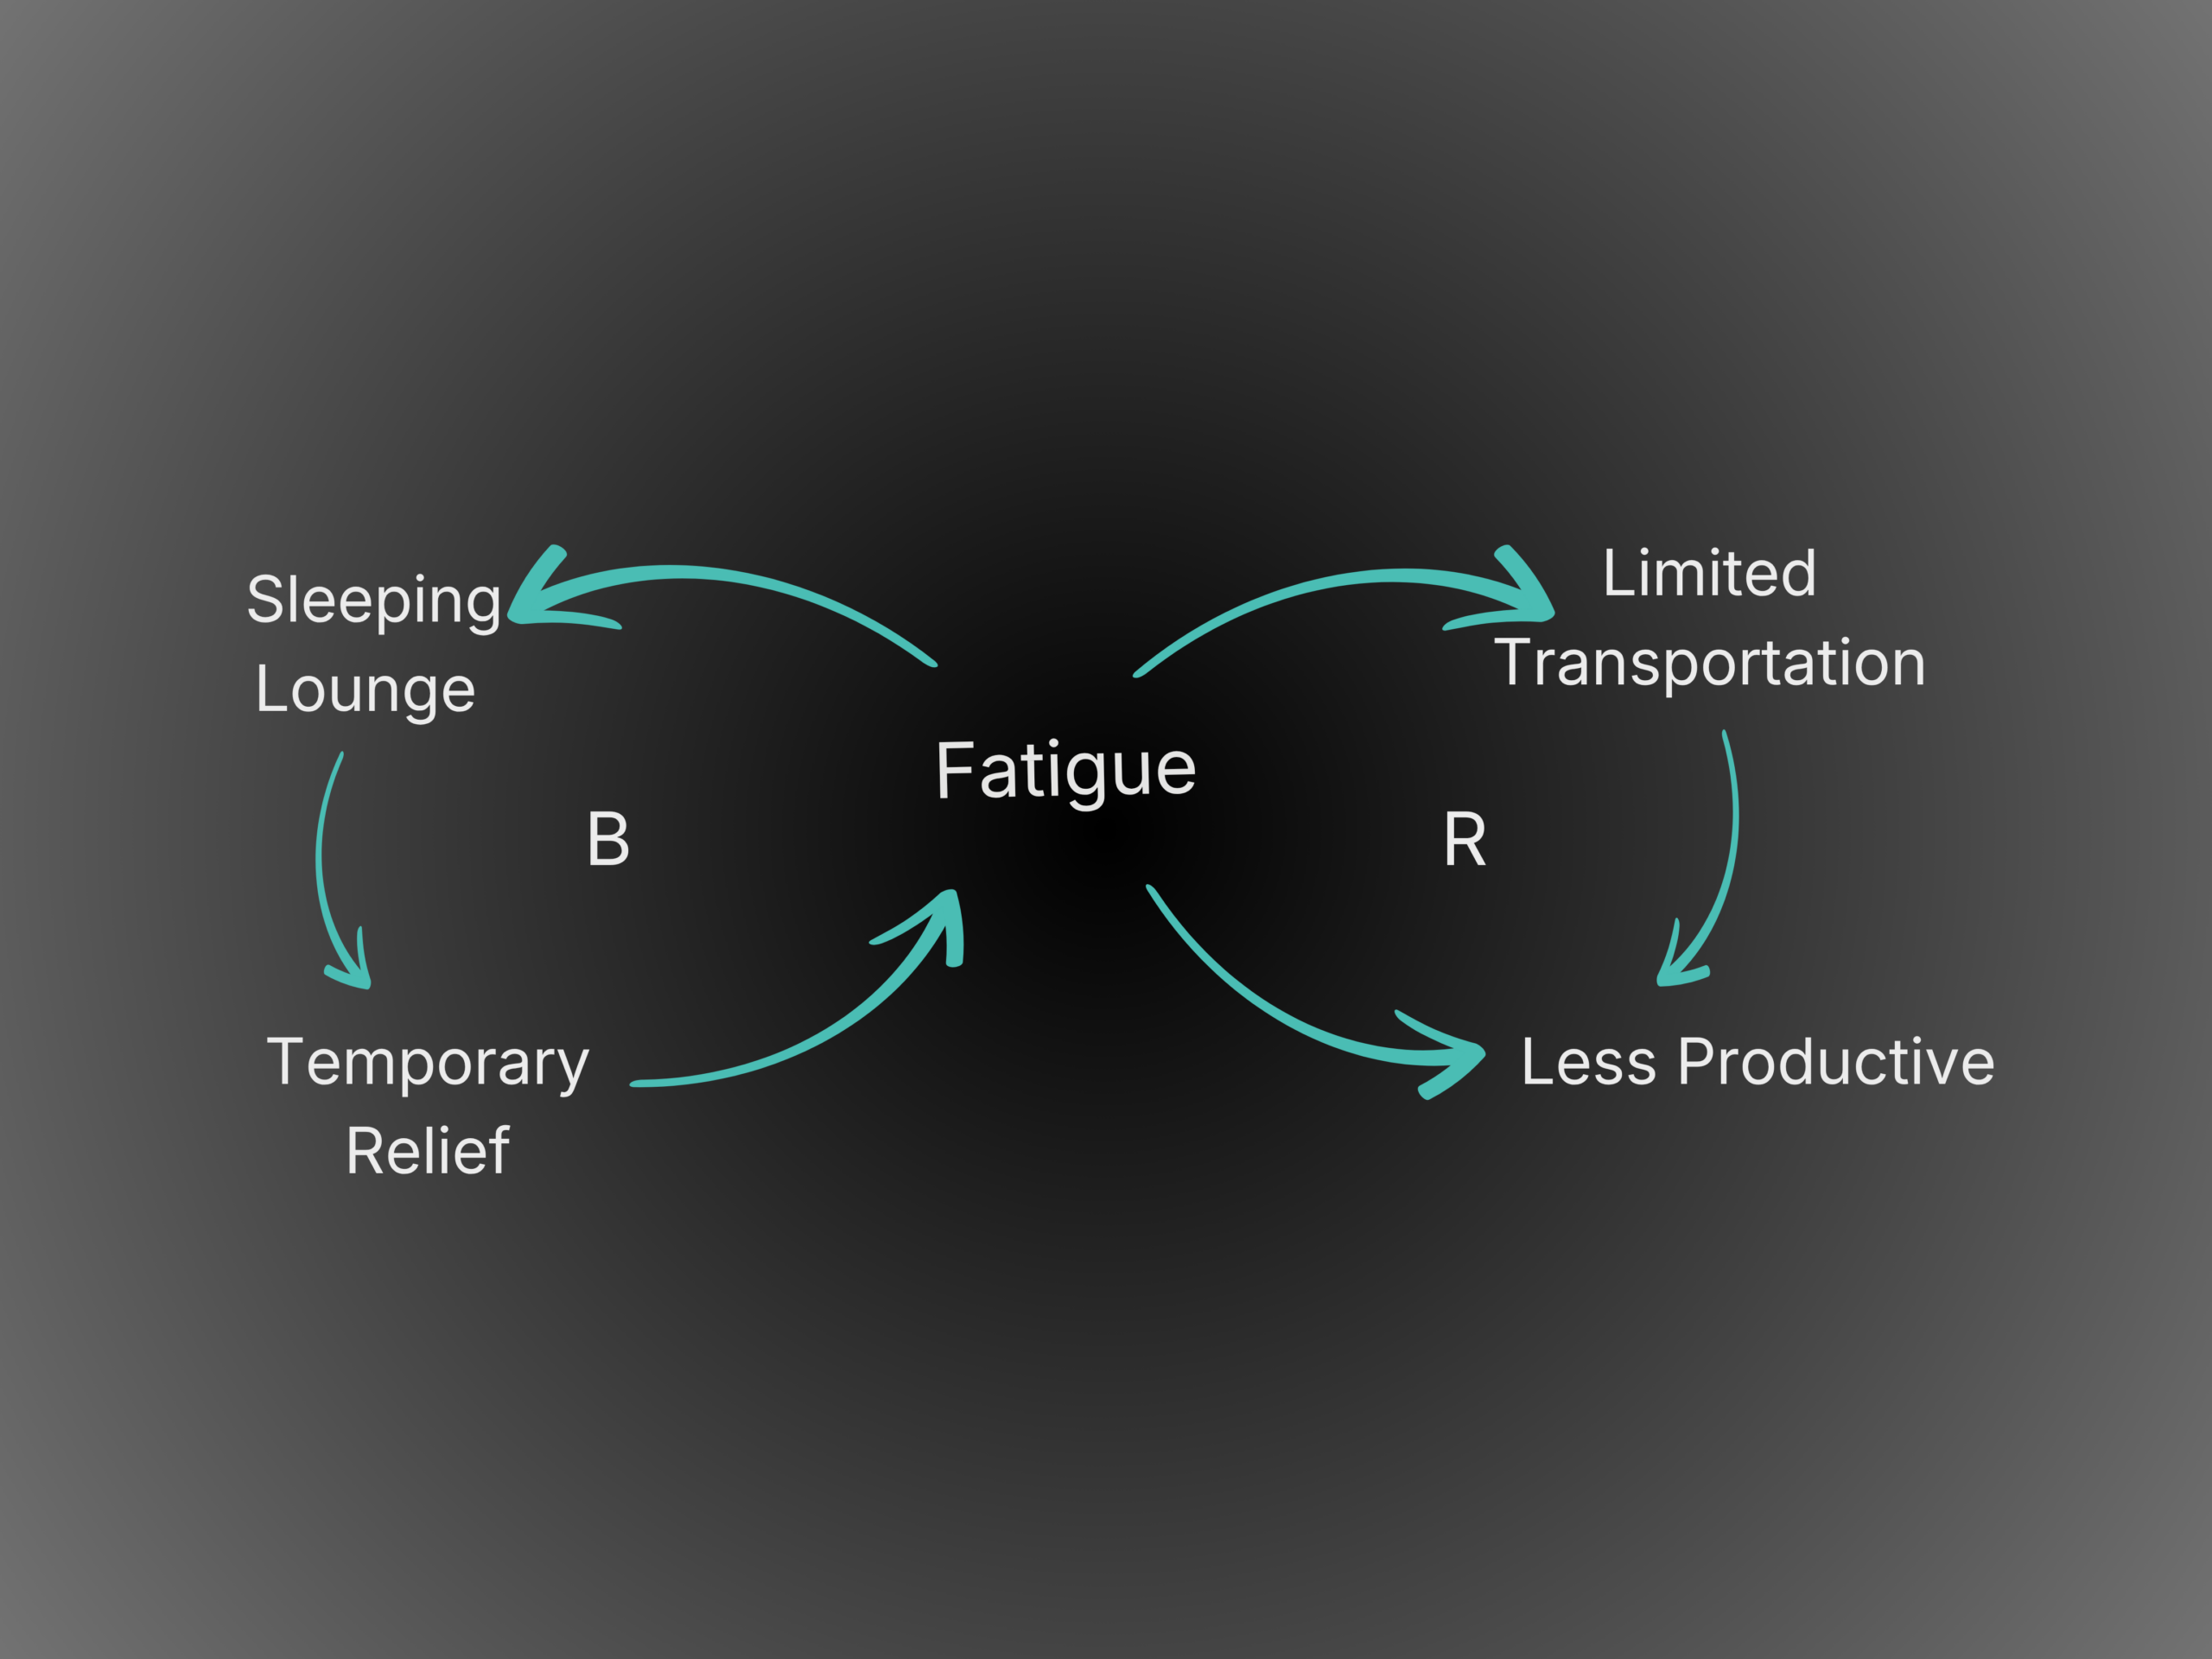
figure 1: Simple Casual Loop Diagram (Adapted from kim 2000) How to Boost productivity while working for a graveyard shift
The client revisions weren’t about being indecisive
Years later, a different pattern showed up in my freelance work. I kept getting rounds of revision requests from clients, and I started doing the thing people do when they can’t find the cause: blaming the other side. Maybe they’re just indecisive. Maybe I’m missing something in my process.
I came across the Iceberg Model around this time, and it gave me a way to stop guessing. The model splits a problem into three levels: the event you can see, the pattern underneath it, and the structure underneath that.
At the event level, the visible problem was projects not landing where the client expected. At the pattern level, I noticed this wasn’t a one-off. It kept happening across different clients, which meant something in my process was repeating the issue, not any one client’s personality. At the structure level, the answer was less flattering than I wanted: I hadn’t been discussing expectations in enough detail before starting work. I was also taking on more clients than I could give that level of upfront discussion to.
Once I saw the structure, the fix wasn’t complicated. I slowed down the intake process and spent more time on expectations before any work started. Revisions dropped. The pattern didn’t go away because clients suddenly got easier to work with. It went away because I stopped skipping the conversation that would have caught the mismatch early.
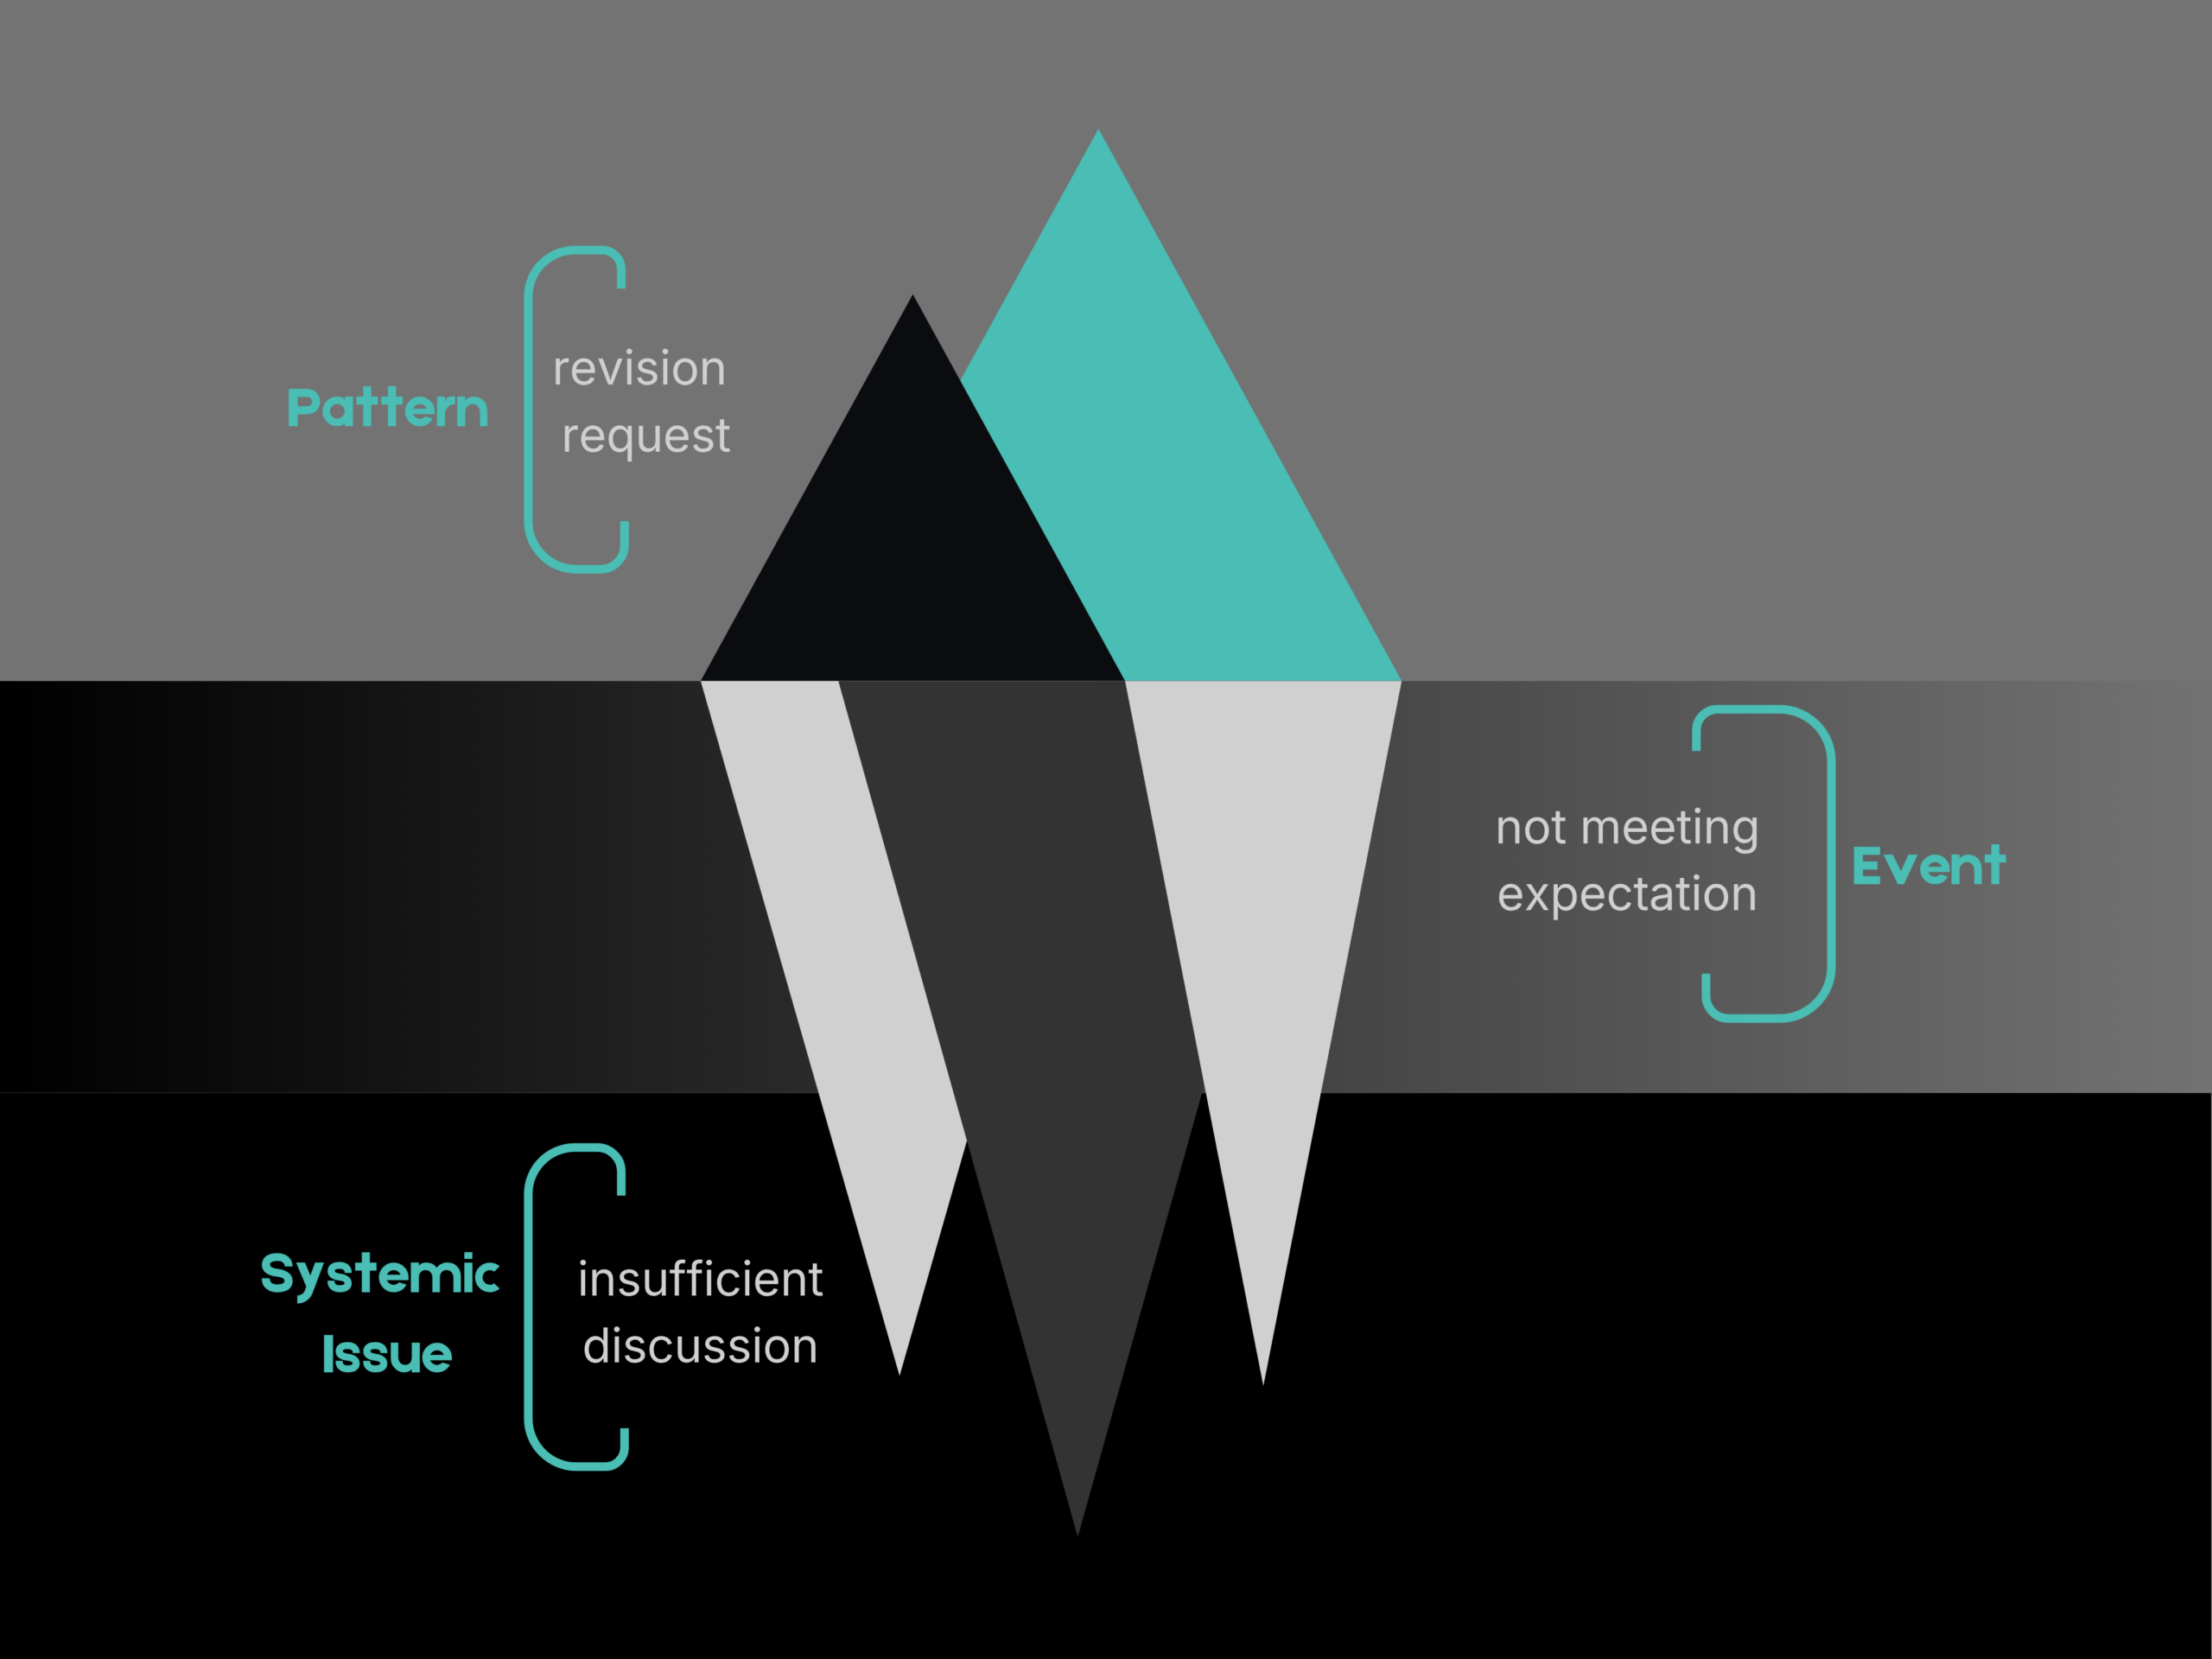
figure 2: Iceberg Model (Adapted from Kim 2000) Why There’s a constant revision from Client’s Requests
What both of these taught me
In both cases, the visible problem, fatigue, revisions, wasn’t the actual problem. It was a symptom sitting on top of something structural: a feedback loop I hadn’t mapped, or a process gap I hadn’t named. Treating the symptom directly, more alarms, more explanations to frustrated clients, didn’t touch either root cause.
I use both of these tools now when a problem in a course or a client engagement keeps repeating instead of resolving. If something has come up more than once, I’ve stopped asking “what happened this time” first. I ask what’s feeding it, and what’s underneath the pattern.
What’s a problem in your own work that kept coming back no matter how many times you fixed the surface version of it?
References
Bond, A., Lockee, B., & Blevins, S. (2023, October 31). Instructional Designers as Institutional Change
Agents. Educause Review. https://er.educause.edu/articles/2023/10/instructional-designers-as-institutional
change-agents
Kim, D. H. (1999). Introduction to Systems Thinking. Pegasus Communications.
https://thesystemsthinker.com/wp-content/uploads/2016/03/Introduction-to-Systems-Thinking
IMS013Epk.pdf
Kim, D. H. (2000). Systems thinking tools. Pegasus Communications, Inc.
https://thesystemsthinker.com/wp-content/uploads/2016/03/Systems-Thinking-Tools-TRST01E.pdf
Lyon, A. (2017, 22 February). Systems Theory of Organizations [Video file].
https://www.youtube.com/watch?v=1L1c-EKOY-w